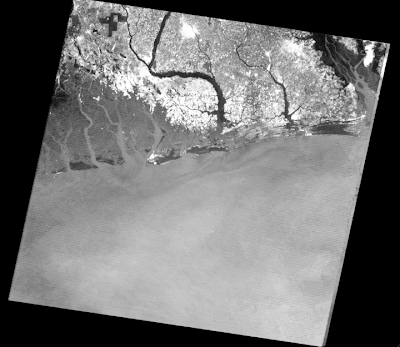
Displayed below are images of the study area from December 19, 1986; December 17, 2000; and January 3, 2007. These images were created by first creating a Normalized Difference Vegetation Index (NDVI) and then overlaying density slices on top of the images. Figures 1-3 portray density slices of vegetation, in particular that of mangroves. Figures 1-3 use red, green and purple to represent vegetation whereas grey represents land and black represents water. Figures 3-6 portray density slices of freshwater (blue), saltwater (green) and oil (yellow). The mixing of saltwater and freshwater creates brackish water which is typical of mangroves and estuaries. Thus, in these figures all mangroves are located where there is a mixture of salt and fresh waters or where blue and green images occur together. Furthermore, it was concluded that the yellow in the figure represents oil. In creating a density slice using ENVI all values less than one represent those of fluids. Green is -0.7500 to -0.500, blue is -0.500 to -0.2500, and yellow is -0.2500 to -0.1000. Latitude and longitudes were taken from the locations of the gas flare images and dredging sites found using Google Earth and then compared to the density slice images created using ENVI. Using the "Pixel Locator" on ENVI the latitudes and longitudes of the gas flare and dredging site locations were inputted. All of the locations of these sites occurred in the yellow areas of the image which led to the conclusion that the unknown fluid was that of oil which had seeped into the mangroves. In addition to being oil, it is also hypothesized that the yellow shaded areas also represent polluted brackish water within the mangrove system.
Figure 1: December 19, 1986 Vegetation Density Slice
Figure 2: December 17, 2000 Vegetation Density Slice
Figure 3: January 3, 2007 Vegetation Density Slice
Figure 4: December 19, 1986 Water Density Slice
Figure 5: December 17, 2000 Water Density Slice
Figure 6: January 3, 2007 Water Density Slice
Figure 7: 1986-2000 Change Detection Analysis
Figure 8: 2000-2007 Change Detection Analysis
Figure 9: 1986-2007 Change Detection Analysis
Figure 10: 1986 Thermal image and thermal subset
Figure 11: 2007 Thermal image and thermal subset


No comments:
Post a Comment