The Niger Delta is home to one of the most extensive mangrove forests in Africa and one of the largest deltas in the world. Rich in biodiversity and natural resources the Niger Delta thrives with life and economic potential. However, today this is not the case as the Niger Delta is under threat leaving it classified as "critical/endangered" and one of the five most degraded environments on the planet. Nigeria has been cursed with "black gold" as transnational oil corporations continue to degrade the environment in search of oil. The production of oil is the main culprit of mangrove deforestation and according to a survey from 1999, it is estimated that nearly 50 percent of Nigerian mangroves have been lost to deforestation by oil companies through the dredging and canalization of the delta (Ohimain). This paper hopes to research the extent of the loss of mangrove forest due to oil production as well as propose solutions for the future.
Monday, November 14, 2011
Introduction

The Niger Delta is located in the southern part of Nigeria where the Niger River flows into the Gulf of Guinea. Bordering the Atlantic Ocean, the Niger Delta encompasses over 70,000 square kilometers of floodplain thus making it one of the largest deltas in the world. In addition to being one of the largest deltas in the world it is home to the largest strand of mangroves in Africa and the fourth largest mangrove system in the world (Spalding et al., 1997). These mangroves, particularly of genera Rhizophora and Avicennia, are of local, regional and global importance as they are home to a number of endangered, endemic and potentially vulnerable species. Such species include the pygmy hippopotamus and the West African manatee-both of which are located on the IUCN’s Red List of Threatened Species. Rich in resources and biodiversity, the mangroves in the Niger Delta are under threat and thus have been classified by the World Wildlife Fund as “critical/endangered.”
 |
| Kinako 1977. Map showing the extent of mangrove forest in the Niger Delta. |
The Niger Delta is under threat from an array of sources such as population growth, aquaculture, industrialization and the introduction of invasive species such as water hyacinth (WWF). However, the main threat and the threat that will be focused on in this research project is that of oil. Oil has fouled everything in Southern Nigeria making it the major cause of loss of biodiversity and mangrove deforestation within the delta. Despite being the root of the delta’s environmental degradation, oil discovery and production has become a godsend to the economy of Nigeria making it the largest oil producer in Africa and among the top ten in the world. Oil and gas, mainly from the Niger Delta, form the backbone of the Nigerian economy as oil provides 90% of Nigeria’s GDP, 95% of foreign exchange earnings and about 65% of budgetary revenues (Nwilo/Badejo). With 45% of the population below the poverty line, oil has provided a means to an end for many Nigerian workers even if it comes at the cost of destroying one of the most biologically diverse areas in the world.
Oil exploration in Nigeria first began in 1937 and in 1956 oil and gas deposits were first discovered by Royal Dutch Shell in the town of Oloibiri (Bentley). It was not until two years later in 1958 that the oil was actually drilled. Shortly after in 1960 Nigeria gained its independence and by the mid-1970's had joined OPEC, the Organization of Petroleum Exporting Countries (O'Neill). The discovery along the coast sparked hope of an economic boom that would help elevate the standard of living in Nigeria. The excitement radiated amongst Nigerians and transnational oil corporations-Royal Dutch Shell, Total, Agip, ExxonMobil and Chevron/Texaco-as the promise of wealth lurked beneath the delta’s surface. Today, this excitement has turned into a curse of black gold.
This curse has led to the heavy exploitation of resources leaving the Niger Delta as one of the five most polluted and degraded places on the planet (K.K.). Ninety percent of Nigeria's oil production originates from the Niger Delta and surrounding offshore areas (Snowden/Ekweozor). The core oil producers include Baylesa, Rivers, Delta and Akwa Boom State with refineries located in Port Harcourt I and II, Warri, and Kaduna (Nwilo/Badejo). Within this network of oil production, the Niger Delta is currently home to numerous production platforms, refineries, tank farms, tankers, loading terminals, flow stations and a network of pipelines. Figure 1 below demonstrates the vast amount of oil related activities within the delta which represent the potential sources of oil pollution and mangrove destruction. As a result, Nigeria is home to 4,500 miles of pipelines, 606 oil fields (360 on-shore/246 offshore), 275 flow stations, all which leave "their gas flares visible day and night from miles away" (O'Neill, Nwilo/Badejo). Figure 2 demonstrates gas flare images which were found using Google Earth.
 |
| Snowden/Ekweozor |


Within these areas of oil production oil spills are a common occurrence and generally go unmonitored or are monitored in a questionable manner (Snowden/Ekweozor). Oil companies have operated in the delta for many years with little to no environmental insight and up until 1988 there was no federal environmental protection agency (O'Neill). In 1992, environmental impact assessments were mandated yet even today most companies do not follow through with them. As a result of this negligence, the delta is being pushed to ecological disaster. Oil leaks are often patched up without cleaning up sites and gas flares are left to burn resulting in acid rain and the release of greenhouse gases (O'Neill). In addition, the means for people to sustain themselves is being wiped out as the wood that they collect from the mangroves as a fuel source can no longer be collected as it is polluted with oil. These oil spills also pollute groundwater and freshwater sources that are used for drinking and washing as well as result in the destruction of cropland. Oil is the primary culprit for the "defoliation and death of mature mangroves and seedings" (Snowden/Ekweozor). Between 1976 and 1996 the government documented 4,647 spills resulting in 2,369,470 barrels of oil spilled into the environment. More recently from 1997-2001, 2, 097 oil spill incidents were reported yet this number might actually be ten times higher (O'Neill, Nwilo/Badejo). Recorded oil spills include the one on April 24, 1984 when a barge sank in the Bonny Estuary spilling 250 barrels of Nigerian crude oil, the one in 1998 where 40,000 barrels were spilt into the environment off of the Mobil platform in Akwa Ibom, the 1978 GOCON Escravos spill of 300,000 barrels, 1978 SPDC Forcados Terminal tank failure resulting in 580,000 barrels, January 17, 1980 Funiwa 5 blowout of 37.0 million litres and countless others.
 |
| Chart of major oil spills within the delta (Bentley) |


 |
| Ohimain 2004 |
 |
| http://cas.umkc.edu/GeoSciences/LCAM/NIGER_DELTA/Pictures/Dredging_mangroves.jpg |
 |
| Ohimain 2004 Currently as a result of all the environmental degradation, political instability and corruption occurring in the delta local people are starting to retaliate. Relentless crisis is growing as attacks on oil platforms and pumping stations are being done by a secretive group of armed hooded rebels who call themselves MEND or Movement for the Emancipation of the Niger Delta (O'Neill). The people are beginning to speak up for their rights yet little is being done by the government or by the oil companies. Only time will tell what is held in the future for Nigeria and hopefully it will be a future filled with positive growth and change for the Nigerian people. |
Methodology
For the purposes of this study, mangrove forests within the Niger River Delta are studied ranging from latitude 4°10' to 6°20' N to longitude 2°45' to 8°35' E. Mangrove forests are threatened worldwide, and within the world's largest delta it is not hard to see the vast amount of mangroves currently under threat in Nigeria (Nwilo/Badejo). Mangroves in the Niger River Delta are under threat from a multitude of sources including their main threat, that of humans. Currently, humans have a large stake-hold within the delta as it is an untapped resource of crude oil and natural resources. Oil companies have thus made Nigeria their "home" and continue to deplete the land of its resources. With oil production comes environmental degradation and within the delta the mangroves are suffering. The area of mangroves within the delta is decreasing and with the use of remote sensing we can see the rate and extent as to which the mangroves are being destroyed.
In using remote sensing for this project, Landsat TM and ETM+ images were used from the Landsat 7 and Landsat 5 satellites. The project portrays a time series of the delta from images from December 19, 1986, December 17, 2000 and January 3, 2007. Landsat images were obtained and downloaded from the Global Land Cover Facility (GLCF) at the University of Maryland. In total 3 Landsat images were used.
These images were then loaded using ENVI 4.8, a software that is used for remote sensing manipulation. Bands 1 (blue), 2 (green), and 3 (red) represent the image in the visible electromagnetic spectrum.
 |
| 1986 Visible |
 |
| 2000 Visible |
 |
| 2007 Visible |
 |
| 2007 ETM+ with bad values (stripes) |
Next the images were loaded using the layering of the red, near-infrared and mid-infrared bands (3,4,5). Layering the bands in a specific fashion of 4, 5, 3 RGB (Red-4, Green-5, Blue-3) helps produce an image that allows for the easy viewing of mangrove vegetation (dark salmon color). This is what is known as an unsupervised classification which helps clearly define the vegetation, i.e. mangroves in these images. Unsupervised classifications group together pixels of similar spectral properties into distinct classes. The images below show the images in an unsupervised classification of RGB 4,5,3. Mangrove forests turn a salmon color and are thus easily distinguished from land and other types of vegetation. In the images themselves blue represents water, yellowish/orange represents land and other types of vegetation and the pinkish/salmon color represents the mangroves.
 |
| 1986 RGB 4,5,3 |
 |
| 2000 RGB 4,5,3 |
 |
| 2007 RGB 4,5,3 |
 |
| 1986 NDVI |
After conducting a NDVI then we can use density slice overlays which use color theory in showing the different types of vegetation present in the image. Color theory is extremely helpful and useful when analyzing these images because it allows the researcher to see the extent of vegetation as well as different types of vegetation present. In addition to vegetation, density slices also show the type of water present in the delta whether they be fresh, salt or polluted water sources. Density Slice images can be found under the "Results" section of this blog.
Lastly, in interpreting the loss of mangrove forest within the Niger Delta change detection analyses were conducted. Change detection analyses were conducted from 1986-2000, 2000-2007 and then overall from 1986-2007. Change detection helps show the change in the extent of vegetation over time. In the images blue represents a decrease in greenness whereas red represents an increase in greenness. Different shades of the colors, particularly darker shades intensify the increase or loss of greenness. However, it must be noted that in these images the red that is located in the rivers and tributaries represent an increase in polluted water. Also, due to cloud images in the 2000 images the intensified color is an anomaly. Change detection analyses images can be seen in the "Results" section of the blog as well.
Images using the thermal bands were also used to help detect the location of gas flares. These images can be found in the "Results" section as well.
Results
Displayed below are images of the study area from December 19, 1986; December 17, 2000; and January 3, 2007. These images were created by first creating a Normalized Difference Vegetation Index (NDVI) and then overlaying density slices on top of the images. Figures 1-3 portray density slices of vegetation, in particular that of mangroves. Figures 1-3 use red, green and purple to represent vegetation whereas grey represents land and black represents water. Figures 3-6 portray density slices of freshwater (blue), saltwater (green) and oil (yellow). The mixing of saltwater and freshwater creates brackish water which is typical of mangroves and estuaries. Thus, in these figures all mangroves are located where there is a mixture of salt and fresh waters or where blue and green images occur together. Furthermore, it was concluded that the yellow in the figure represents oil. In creating a density slice using ENVI all values less than one represent those of fluids. Green is -0.7500 to -0.500, blue is -0.500 to -0.2500, and yellow is -0.2500 to -0.1000. Latitude and longitudes were taken from the locations of the gas flare images and dredging sites found using Google Earth and then compared to the density slice images created using ENVI. Using the "Pixel Locator" on ENVI the latitudes and longitudes of the gas flare and dredging site locations were inputted. All of the locations of these sites occurred in the yellow areas of the image which led to the conclusion that the unknown fluid was that of oil which had seeped into the mangroves. In addition to being oil, it is also hypothesized that the yellow shaded areas also represent polluted brackish water within the mangrove system.
Figure 1: December 19, 1986 Vegetation Density Slice

Figure 2: December 17, 2000 Vegetation Density Slice

Figure 3: January 3, 2007 Vegetation Density Slice

Figure 4: December 19, 1986 Water Density Slice

Figure 5: December 17, 2000 Water Density Slice

Figure 6: January 3, 2007 Water Density Slice

Figure 7: 1986-2000 Change Detection Analysis

Figure 8: 2000-2007 Change Detection Analysis

Figure 9: 1986-2007 Change Detection Analysis
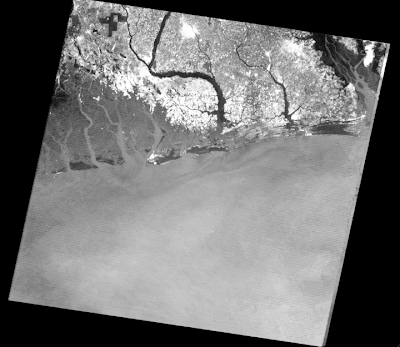

Figure 10: 1986 Thermal image and thermal subset


Figure 11: 2007 Thermal image and thermal subset


Discussion
Through the findings of this research it can be concluded that in fact the mangrove forests in the Niger Delta have decreased due to the presence of oil within the delta. Even though the extent of impacts arising from oil exploration and dredging in the Niger Delta have not been well documented it can be seen from these images that these activities are in fact detrimental to the mangroves in the Niger Delta. These unfortunate ecological consequences can be seen in both the change detection analyses as well as the density slice overlays. In the 1986 density slice vegetation overlay there is few mangrove vegetation within the delta most likely a result of the disastrous oil spills that occurred in 1979 and 1980. Bonny Island is in-fact the hardest hit area as it is where the most devastating oil spill occurred. Then as time went on and management of oil spills improved, the Niger Delta had time to regenerate its mangroves and restore the environment. This is shown in the 2000 density slice vegetation overlay where the image is covered in red referring to vast amounts of lush vegetation. Then as time went on and the world hunger for oil increased Nigeria began to produce more and more oil to fulfill the world's demand. At the same time they were fulfilling their desire of wealth and an improved economy. However, this wealth was at the expense of their environment. Thus, in 2007 once again we see a degraded environment as a result of more oil spills and more oil production sites were built. As a result, oil continues to degrade the Niger Delta's environment and the lush and unique mangroves that call this area home. In addition, it can be noted that there is more oil that has leaked into the environment as seen in the increase in yellow in the 2007 density slice image as compared to the amount of yellow found in the 1986 and 2000 images.
Furthermore, in analyzing the change detection analyses we can also see the decrease in mangrove forest. From 1986 to 2000 the least amount of vegetation was lost as it took years for the consequences of this environmental degradation to actually take effect. Then from 2000-2007 we can see a large decrease in the amount of vegetation in the delta represented in blue and polluted waters represented in red. Then, encompassing the 1986 and 2007 image and conducting a change detection analysis we can see that the outer fringes of the mangroves have been hardest hit in the areas closest to Bonny Island and Port Harcourt. Lastly, the change detection analysis images were then subset where the color was intensified the most not including the cloud anomaly. The latitude and longitudes of these areas were then inputted into Google Earth and shockingly enough these were sites of oil production, dredging canals, gas flares and visible mangrove deforestation. The figures below represent the Google Earth findings correlated to the ENVI change detection analyses.


Lastly, the thermal band (band 6) was loaded into ENVI in an attempt to locate sources which emitted heat such as gas flares. In analyzing the images on ENVI images that are portrayed in bright white that light up are warmer than those of black and grey areas. Certain speckles of illuminated white appear in areas known for oil production in the Niger Delta. The "cursor location value" tool was used on ENVI to obtain the latitude and longitude of the location of these areas which were emitting heat. Then the latitude and longitudes were inputted into Google Earth for a real time image of the area. It turns out that these sources were in fact gas flares that were left to burn. Interestingly enough the location of the gas flares was the same in both the 1986 image as well as the one from 2007 showing that these gas flares were burning and continue to burn for a time span of over 21 years. As gas flares burn they continue to release greenhouse gases which leads to climate change as well as acid rain and pollution. Below are images taken from ENVI and Google Earth.
Latitude and longitudes used:
4°33'12.82" N 7°2'40.45" E
4°34'33.26" N 6°53'21.71" E


In doing this research, it was discovered that the literature about the degradation and ecological disaster in the Niger Delta does in fact exist. Articles about the deforestation of mangroves and the impacts of oil are not difficult to come across as they seem to be one of the quite popular case studies of students studying at the University of Port Harcourt. Nigerians are interested in their home country and thus are invested in educating themselves and others about the stresses that the Niger Delta faces. However, even with the literature available it still seems as if little is being done to actually stop oil spills, the dredging of canals, deforestation of mangroves and gas flaring. Little is also known about the actual extent of the damage as well as the number of hectares of mangrove forest that has been lost. Regulations and laws are in place yet they are often not enforced. If the Niger Delta is to be saved then stronger laws and regulations need to be created and actually enforced. In addition, research of the Niger Delta using spatial analysis is quite limited. Few literature exists on this topic and only one article was found that incorporates the use of Geographic Information Systems (GIS) to monitor spills and their trajectories. Only one research article that incorporated the use of remote sensing was found which was also from a UCLA student studying the vegetation in the Niger Delta. Hence, with the use of remote sensing and GIS scientists can better understand the effects that oil has on mangrove forest as well as monitor and model trajectories of oil spills.
Other issues that were encountered was the lack of availability of satellite imagery. Most of the images that were found had extensive cloud cover that made it nearly impossible to interpret the images. Of the images that were found, problems unzipping and opening the files was a common problem. The scarcity in the range of dates of the images taken was also an issue leaving the oldest image from 1986 and the most recent from 2007. Both of these images were used in this project. In addition, fewer images of the western side of the delta could be obtained even though oil production on the western side occurs at the same rate as production on the eastern side. All of the images used in this study are from the eastern side as they allowed for a time series to be conducted.
Avenues of future research include a spatial assessment of the western side of the delta because it is under threat as well. In addition, raising awareness about the crisis in the Niger Delta should also be done. It is believed that raising awareness will help Nigerians and others save the delta and its biodiversity. Volunteer clean up crews can be organized and the standard of living for local people should be improved. Once Nigerians are able to support themselves only then will they be able to support and conserve their environment. Regulations should be enforced and old and corroded pipes should be replaced. Lastly, images from the satellite Nigeria I should also be used so that further research can be conducted. With positive change and progress there is hope for Nigerians and the Niger Delta. Only once something becomes devastated enough will people stand up and fight for it. Unfortunately, the Niger Delta is at this point.
Furthermore, in analyzing the change detection analyses we can also see the decrease in mangrove forest. From 1986 to 2000 the least amount of vegetation was lost as it took years for the consequences of this environmental degradation to actually take effect. Then from 2000-2007 we can see a large decrease in the amount of vegetation in the delta represented in blue and polluted waters represented in red. Then, encompassing the 1986 and 2007 image and conducting a change detection analysis we can see that the outer fringes of the mangroves have been hardest hit in the areas closest to Bonny Island and Port Harcourt. Lastly, the change detection analysis images were then subset where the color was intensified the most not including the cloud anomaly. The latitude and longitudes of these areas were then inputted into Google Earth and shockingly enough these were sites of oil production, dredging canals, gas flares and visible mangrove deforestation. The figures below represent the Google Earth findings correlated to the ENVI change detection analyses.

 |
| 4°28'29.89" N 7°36'29.64" E |

 |
| 4°31'20.79" N 7°13'19.49" E |
Lastly, the thermal band (band 6) was loaded into ENVI in an attempt to locate sources which emitted heat such as gas flares. In analyzing the images on ENVI images that are portrayed in bright white that light up are warmer than those of black and grey areas. Certain speckles of illuminated white appear in areas known for oil production in the Niger Delta. The "cursor location value" tool was used on ENVI to obtain the latitude and longitude of the location of these areas which were emitting heat. Then the latitude and longitudes were inputted into Google Earth for a real time image of the area. It turns out that these sources were in fact gas flares that were left to burn. Interestingly enough the location of the gas flares was the same in both the 1986 image as well as the one from 2007 showing that these gas flares were burning and continue to burn for a time span of over 21 years. As gas flares burn they continue to release greenhouse gases which leads to climate change as well as acid rain and pollution. Below are images taken from ENVI and Google Earth.
Latitude and longitudes used:
4°33'12.82" N 7°2'40.45" E
4°34'33.26" N 6°53'21.71" E
 |
| 1986 Gas flares |


 |
| 2007 Gas flares |

In doing this research, it was discovered that the literature about the degradation and ecological disaster in the Niger Delta does in fact exist. Articles about the deforestation of mangroves and the impacts of oil are not difficult to come across as they seem to be one of the quite popular case studies of students studying at the University of Port Harcourt. Nigerians are interested in their home country and thus are invested in educating themselves and others about the stresses that the Niger Delta faces. However, even with the literature available it still seems as if little is being done to actually stop oil spills, the dredging of canals, deforestation of mangroves and gas flaring. Little is also known about the actual extent of the damage as well as the number of hectares of mangrove forest that has been lost. Regulations and laws are in place yet they are often not enforced. If the Niger Delta is to be saved then stronger laws and regulations need to be created and actually enforced. In addition, research of the Niger Delta using spatial analysis is quite limited. Few literature exists on this topic and only one article was found that incorporates the use of Geographic Information Systems (GIS) to monitor spills and their trajectories. Only one research article that incorporated the use of remote sensing was found which was also from a UCLA student studying the vegetation in the Niger Delta. Hence, with the use of remote sensing and GIS scientists can better understand the effects that oil has on mangrove forest as well as monitor and model trajectories of oil spills.
Other issues that were encountered was the lack of availability of satellite imagery. Most of the images that were found had extensive cloud cover that made it nearly impossible to interpret the images. Of the images that were found, problems unzipping and opening the files was a common problem. The scarcity in the range of dates of the images taken was also an issue leaving the oldest image from 1986 and the most recent from 2007. Both of these images were used in this project. In addition, fewer images of the western side of the delta could be obtained even though oil production on the western side occurs at the same rate as production on the eastern side. All of the images used in this study are from the eastern side as they allowed for a time series to be conducted.
Avenues of future research include a spatial assessment of the western side of the delta because it is under threat as well. In addition, raising awareness about the crisis in the Niger Delta should also be done. It is believed that raising awareness will help Nigerians and others save the delta and its biodiversity. Volunteer clean up crews can be organized and the standard of living for local people should be improved. Once Nigerians are able to support themselves only then will they be able to support and conserve their environment. Regulations should be enforced and old and corroded pipes should be replaced. Lastly, images from the satellite Nigeria I should also be used so that further research can be conducted. With positive change and progress there is hope for Nigerians and the Niger Delta. Only once something becomes devastated enough will people stand up and fight for it. Unfortunately, the Niger Delta is at this point.
References
Bentley, Chris, and Matt Hintsa, Mimi Liu, Liz Moskalenko and Stacey Ng. "The Oil Crisis in the Niger River Delta." 1-19.
Gabriel, A.O.I. "Women in the Niger Delta: Environmental Issues and Challenges in the Third Millennium."
"GLCF: Earth Science Data Interface." GLCF: Welcome. Web. 14 November 2011. <http://glcfapp.glcf.umd.edu:8080/esdi/index.jsp>.
GOOGLE INC., (2009), Google Earth (Version 5.1.3533.1731) [Software]. Available online at: http://www.google.com/earth/index.html (accessed 14 November 2011).
Kinako, Pius D. S. "Conserving The Mangrove Forst of the Niger Delta." Biology Conservation 11(1977): 35-39
Ohimain, Elijah. "Environmental Impacts of Dredging in the Niger Delta." Terra et Aqua 97(2004): 9-19.
Ohimain, Elijah. "Environmental Impacts of oil mining activities in the Niger Delta Mangrove Ecosystem." 8th International Congress on Mine Water and the Environment, Johannesburg, South Africa 503-517.
O'Neill, Tom. "Curse of the Black Gold: Hope and Betrayal on the Niger Delta." National Geographic February 2007. Accessed on 14 November 2011. <http://ngm.nationalgeographic.com/2007/02/nigerian-oil/oneill-text/1>
Nwilo, Peter and Olusegun T. Badejo. "Impacts and Management of Oil Spill Pollution along the Nigerian Coastal Areas."
Snowden, R.J. and I.K.E. Ekweozor. "The Impact of a Minor Oil Spillage in the Estuarine Niger Delta." Marine Pollution Bulletin 18.11(1987) 595-599.
WWF. "Niger River Delta" 2001. Accessed November 14, 2011. <http://wwfus.org/wildworld/profiles/g200/g155.html> <http://wwf.panda.org/about_our_earth/ecoregions/niger_river_delta.cfm>
Subscribe to:
Posts (Atom)